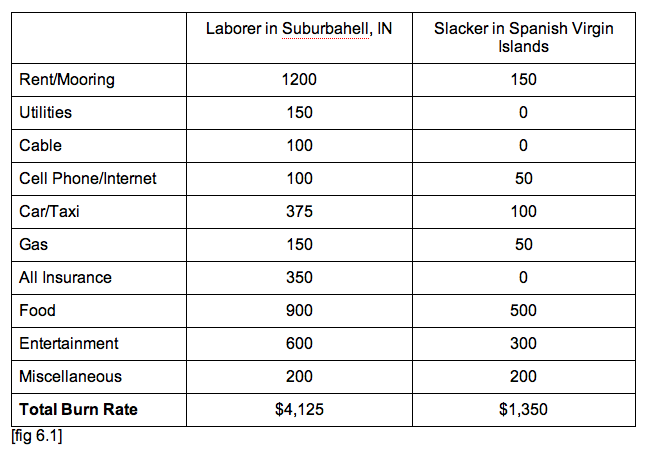
Example of burn rates for two lifestyles. One, a typical suburban existence, the other, a decidedly non-typical Slacker’s burn rate living on his boat in the Spanish Virgin Islands.
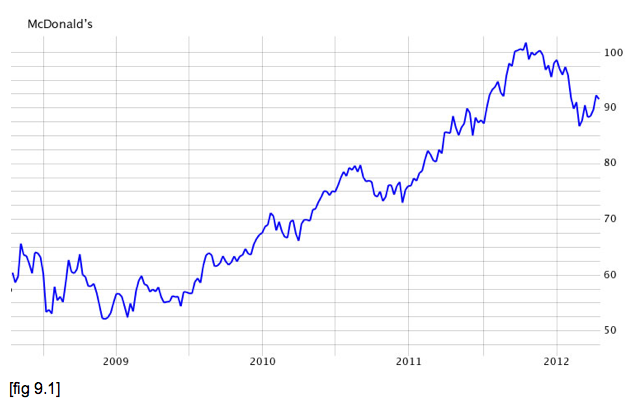
McDonald’s stock price from 2009 to 2012.
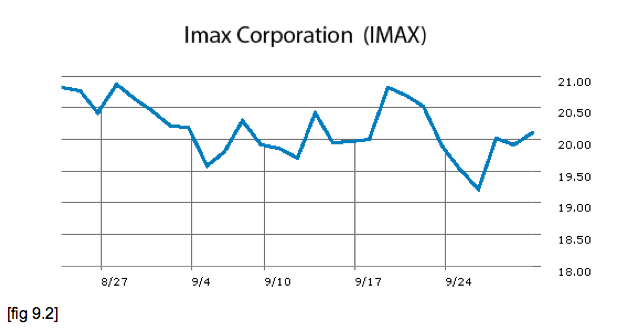
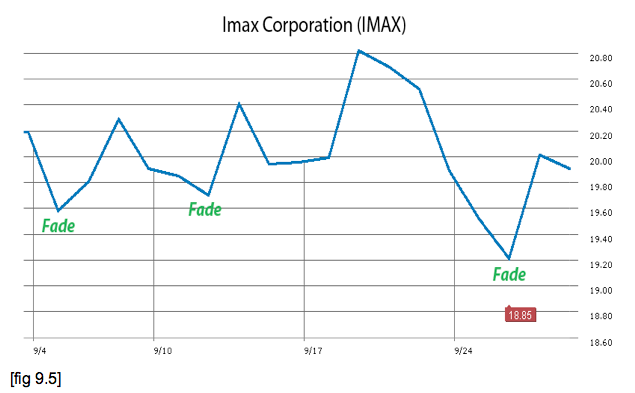
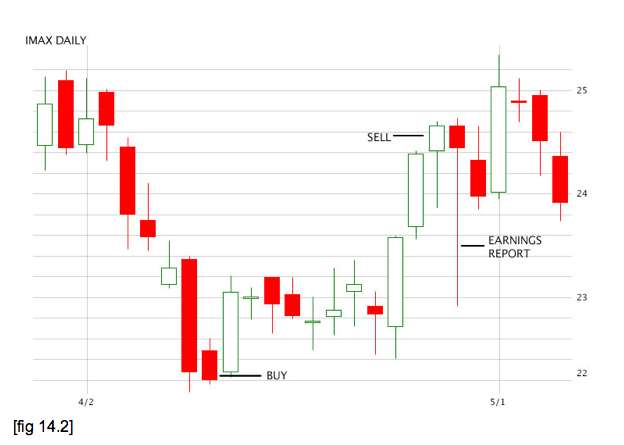
Imax stock price during a period in which we could trade just about any dip.
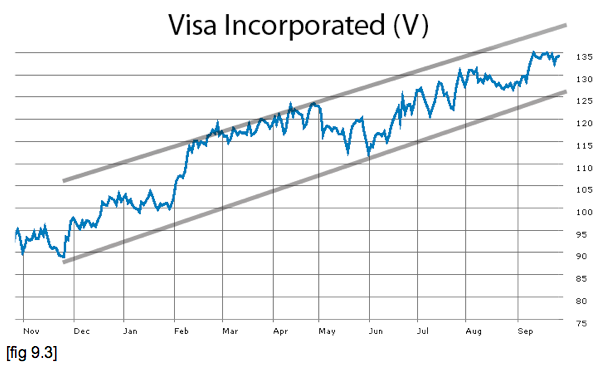
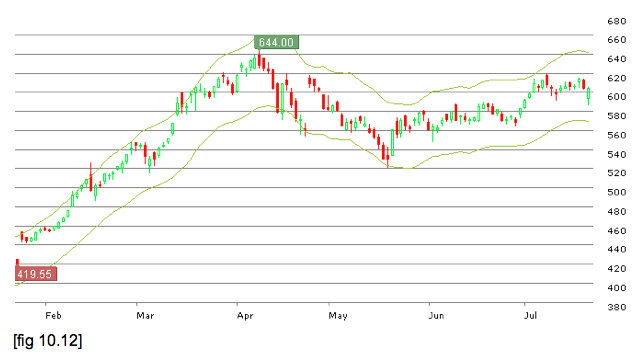
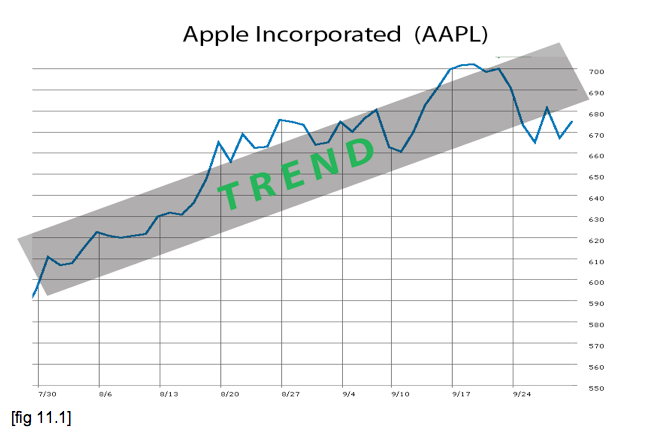
Visa stock chart with trend lines drawn in.
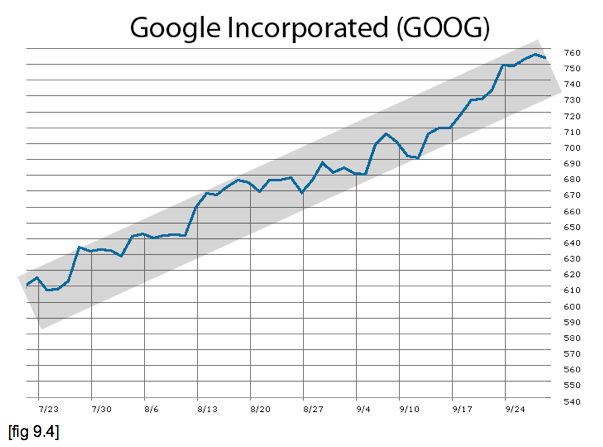
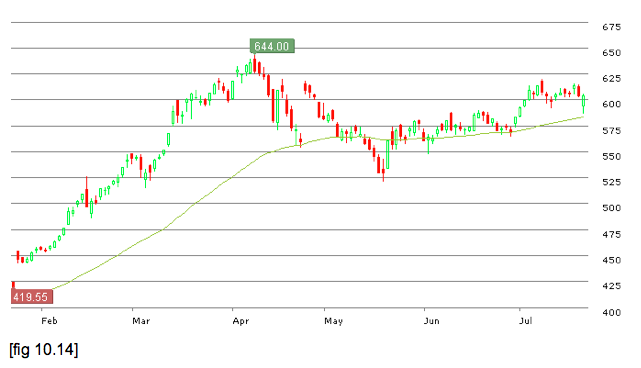
Google stock with trend shaded in.
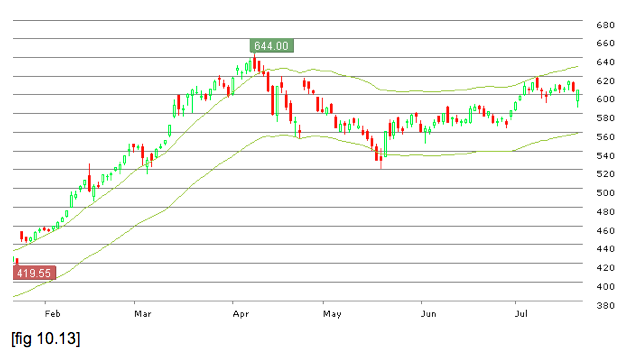
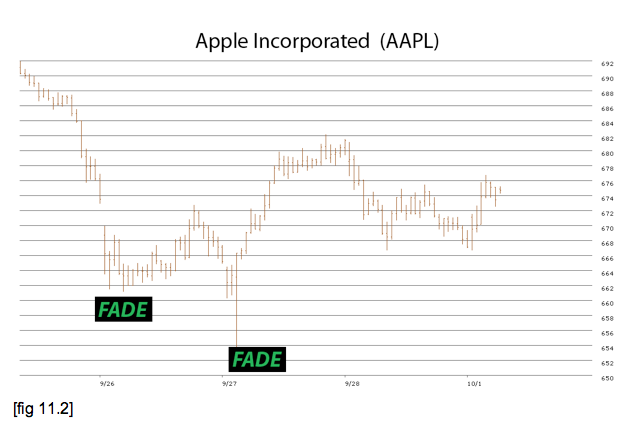
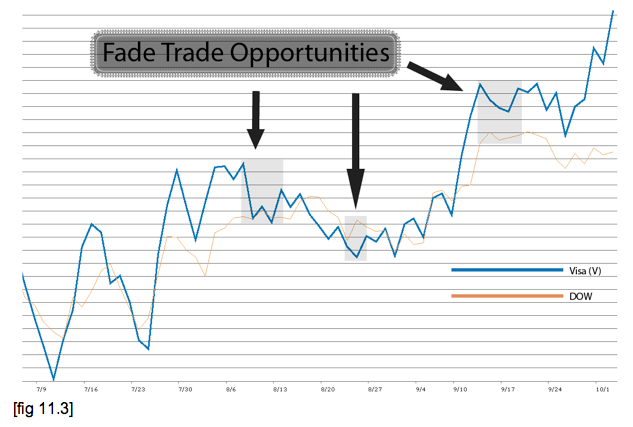
Visa with possible fade trades.
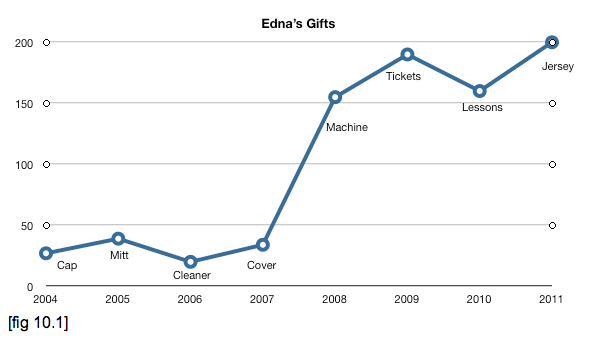
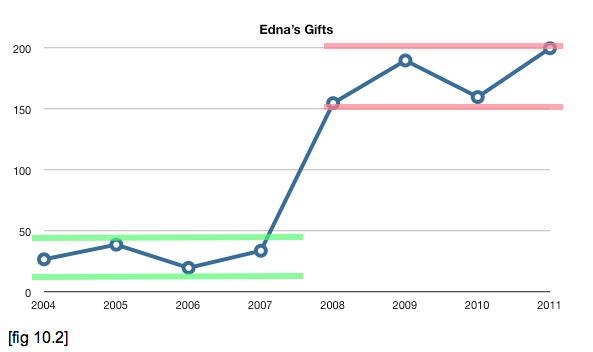
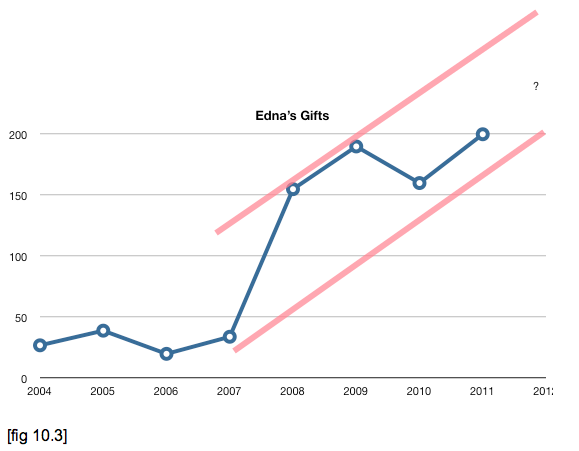
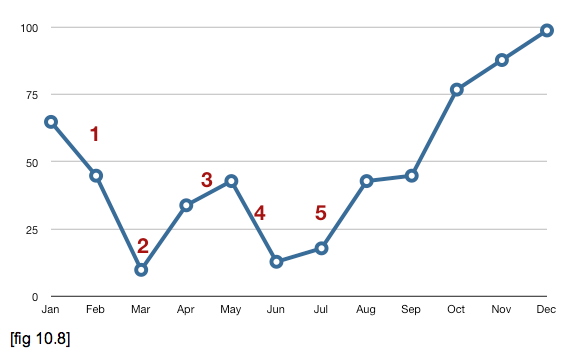
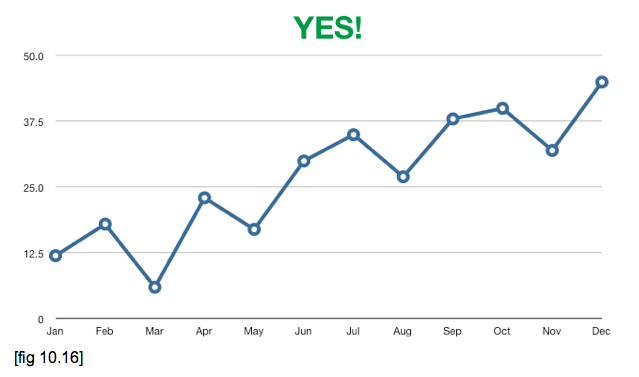
Aunt Edna’s gifts with trend lines drawn in.
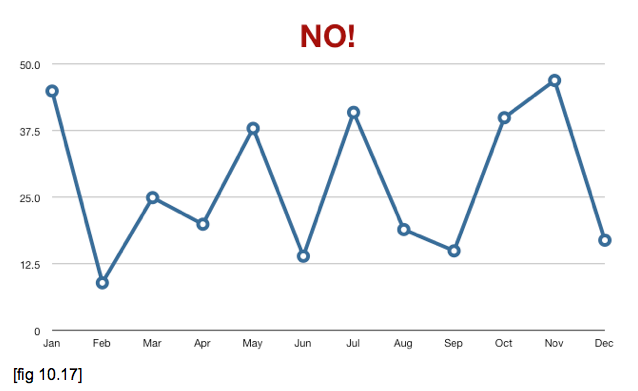
Aunt Edna’s gifts with an incorrect trend line drawn in.
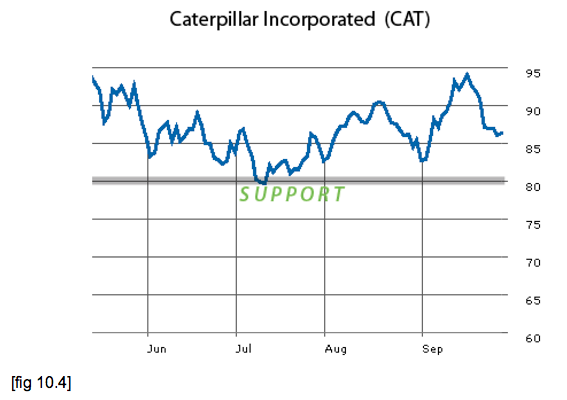
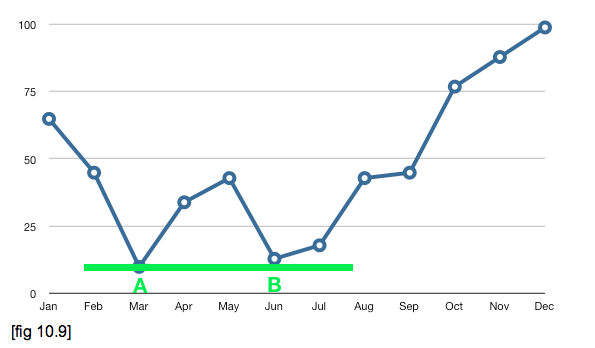
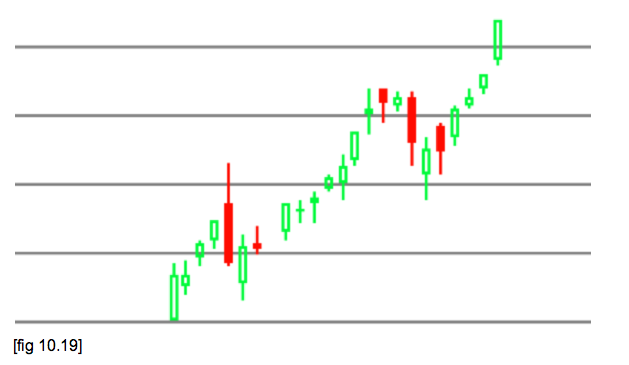
Chart showing support for the stock at around $80.
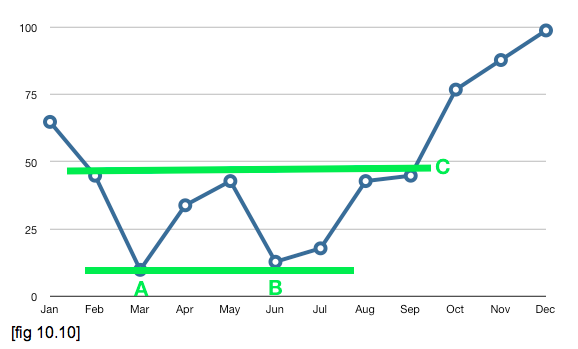
Chart showing resistance for stock at $95.
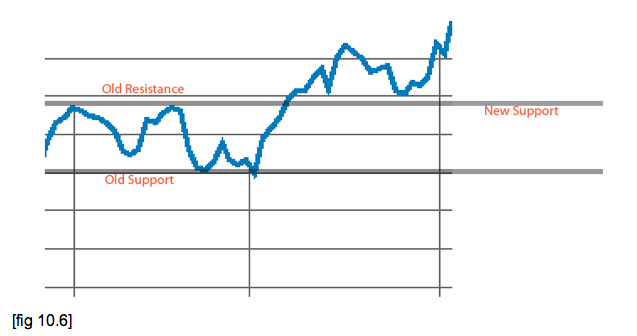
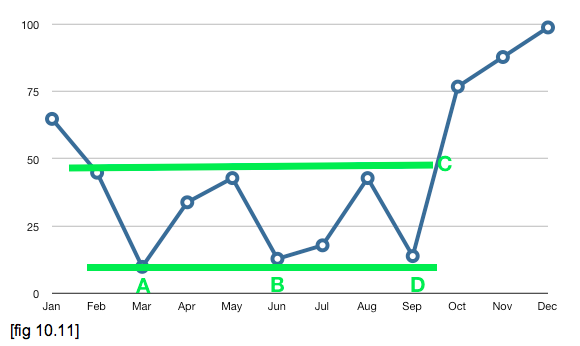
After breaking through resistance that line becomes the new support.